Statistics
Interesting to see the HIUG list proves a very useful tool when trying to find out about HealthOne related issues.
Below is data which was compiled by David Maguire, a Transition Year Student, who was sponsored by Haribos to extract these figures….
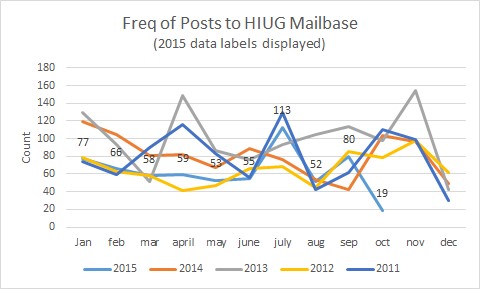
fig1:

The above chart demonstrates when the HIUG Mailbase appears to be most active. The last five years have been analysed giving the diagram above. Clearly, there are times when it is more active, this would usually coincide with
- New updates
- Changes to Health legislation etc
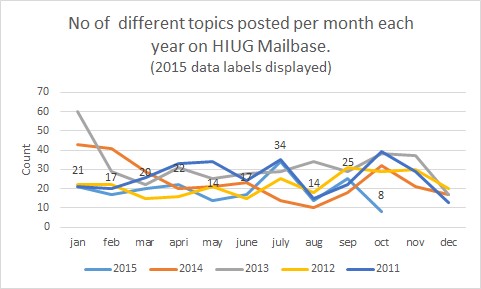
fig2:

This chart tells us the number of different topics which have been posted on a monthly basis. Again the trend for 2015 would suggest July 2015 had the most topics discussed for the year so far.
Many thanks to David for this interesting data collection.
